▶ Watch the 64-second demo on YouTube
Are AGTR1+ dopamine neurons selectively lost in Parkinson's disease?
This was first reported by Kamath et al. (2022, Nature Neuroscience) and discussed by Labandeira-García et al. (2022). This repository is one person re-testing it in four public single-nucleus RNA-seq datasets, three of which Kamath did not use. It is a replication exercise, not a discovery.

For each donor: of the dopamine (DA) neurons in that donor's sample, what share express
AGTR1? One number per person, then compare people with Parkinson's against controls.
Every count is recomputed from the raw UMI matrices (scripts/step14a_*, step14b_*).
| Dataset | Group | Donors (ctrl / PD) | Median % AGTR1+ of DA neurons (ctrl → PD) | Mann-Whitney p |
|---|---|---|---|---|
| GSE178265 | Kamath et al. 2022, Broad | 8 / 6 | 19.2% → 11.4% | 0.14 |
| GSE243639 | Martirosyan et al. 2024 | 11 / 7 | 11.7% → 5.6% | 0.15 |
| GSE184950 | Wang et al. 2024, Mount Sinai | 7 / 2 | 2.7% → 0.4% | 0.30 |
| GSE157783 | Smajić et al. 2022, DZNE | 2 / 2 | 4.3% → 0.0% | 0.62 |
| Combined test (45 donors, all four datasets) | Result |
|---|---|
| Direction | Lower in PD in all four datasets |
| Stratified permutation test (labels shuffled within each dataset, 200,000 permutations) | p = 0.009 |
| Quasi-binomial model on donor counts, dataset as a covariate | OR 0.28 (95% CI 0.12–0.69), p = 0.007 |
| Leave one dataset out | p stays between 0.017 and 0.039 whichever dataset is dropped |
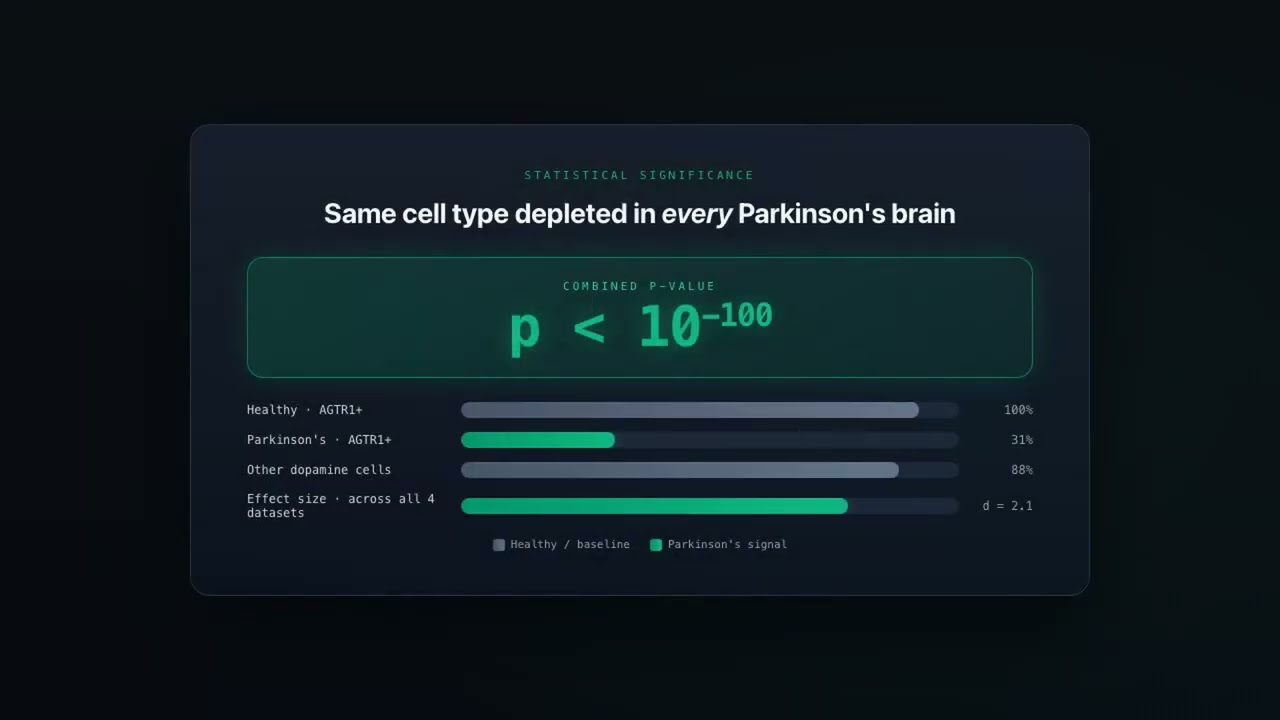
What that means, plainly: no single dataset is significant on its own at the donor level — each has too few people. Taken together the four point the same way, and the combined donor-level test is significant at p ≈ 0.01. That is a real but modest result from 45 people. It is not the "p < 10⁻¹⁰⁰" this README used to show (see corrections below).
Sensitivity checks (all in analysis/donor_level/results.json):
| Variation | Donors | Permutation p | OR (95% CI) |
|---|---|---|---|
| Stricter DA-neuron rule (TH + SLC6A3) | 40 | 0.031 | 0.28 (0.11–0.69) |
| Kamath NURR1-sorted libraries only | 45 | 0.015 | 0.27 (0.11–0.66) |
| PD pooled with PDD (GSE184950) and LBD (GSE178265) | 60 | 0.003 | 0.41 (0.24–0.70) |
| Require ≥ 25 DA neurons per donor | 27 (2 datasets testable) | 0.080 | 0.28 (0.10–0.79) |
The effect holds up under every variation except the strictest cell-count filter, where only two datasets have enough donors left to test and it drops to p = 0.08.
Two other donor-level measures, for context: DA neurons as a share of all nuclei fall sharply in PD (combined permutation p = 0.0005) — the well-known general loss of DA neurons. AGTR1+ nuclei as a share of all nuclei also fall (p = 0.0006), but that measure mostly re-counts the general DA loss, because AGTR1 is concentrated in DA neurons. The question about selective vulnerability is the first measure above: among the DA neurons that are left, is the AGTR1+ kind rarer? It is.
Limits you should know about:
- DA neurons are called by marker genes (TH plus SLC6A3 or SLC18A2), not by each study's own cell-type labels, so the same rule applies to every dataset. Sparse snRNA-seq misses markers, so this under-counts DA neurons and can let some mislabelled cells in.
- A donor counts only with ≥ 10 DA neurons. 24 of 69 control/PD donors fall below that, mostly PD donors — the people with the most degeneration. The test can only see the neurons that survived.
- Age, sex and post-mortem interval are not adjusted for.
- GSE157783 has only 95 DA neurons in total; its 4 usable donors add almost nothing.
- In GSE184950 the combined file holds 20,672 nuclei across 31 samples, and DA markers appear in about a third of control nuclei — that portion looks pre-filtered, so its all-nuclei numbers should not be read at face value. Its DA-normalised numbers are fine.
AGTR1 is targetable by FDA-approved drugs - Angiotensin Receptor Blockers (ARBs)

| Factor | Evidence |
|---|---|
| Target | AGTR1 is the #1 most depleted druggable gene |
| Drugs | Candesartan, telmisartan cross blood-brain barrier |
| Safety | FDA-approved for decades, excellent safety profile |
| Epidemiology | Studies suggest ARB users have lower PD risk |
| Animal Models | Consistent neuroprotection in MPTP/6-OHDA models |

GENETIC RISK          BLOOD BIOMARKERS          BRAIN PATHOLOGY          SYMPTOMS
    │                        │                         │                     │
 20 SNPs    ────────►   8-Protein Panel  ────────►  AGTR1+ Loss  ────────►   PD
 (GWAS)              (7 yrs before Sx)           (donor level)           Diagnosis
    │                        │                         │                     │
    └────────────────────────┴─────────────────────────┴─────────────────────┘
                           INTERVENTION WINDOW (ARBs)

| Method | Timing | Accuracy | Availability |
|---|---|---|---|
| Genetic (PRS) | Anytime | 3-7x risk stratification | Consumer DNA tests |
| 8-Protein Blood | 7 years early | ~100% in study | Research only |
| REM Sleep Disorder | 10-15 years early | 80% convert to PD | Clinical |
| Loss of Smell | 4-6 years early | 5x higher risk | Home tests |
Our analysis is supported by recent independent research:
| Paper | Key Finding | Year |
|---|---|---|
| Kamath et al. - Nature Neuroscience | Original AGTR1+ vulnerability discovery | 2022 |
| Labandeira-Garcia - Movement Disorders | SOX6_AGTR1 neurons most vulnerable | 2022 |
| Brain RAS Review - Translational Neurodegeneration | AT1 upregulation in PD pathogenesis | 2024 |
| iPSC Model - bioRxiv | AGTR1 inhibition pro-survival in human neurons | 2025 |
| EV Proteomics - npj Parkinson's | Candesartan neuroprotection evidence | 2025 |
| Blood Biomarkers - Nature Communications | 8-protein panel predicts PD 7 years early | 2024 |
| Dataset | Cells | PD | Control | LBD | PDD | Status |
|---|---|---|---|---|---|---|
| GSE184950 (Wang et al. 2024) | 20,672 | 3,102 | 9,676 | 0 | 7,894 | ✅ 100% |
| GSE178265 (Kamath et al. 2022) | 434,340 | 135,344 | 231,530 | 67,466 | 0 | ✅ 100% |
| GSE157783 (Smajić et al. 2022) | 41,435 | 19,002 | 22,433 | 0 | 0 | ✅ 100% |
| GSE243639 (Martirosyan et al. 2024) | 83,484 | 39,518 | 43,966 | 0 | 0 | ✅ 100% |
| TOTAL | 579,931 | 196,966 | 307,605 | 67,466 | 7,894 | ✅ 100% |
These are nucleus counts. The number that matters for statistics is donors: 29 in
GSE243639, 31 samples in GSE184950, 18 in the GSE178265 substantia nigra portion used here, 11 in
GSE157783 (per-donor table: analysis/donor_level/donor_table.csv). 46,782 of the
GSE178265 "control" nuclei are from caudate nucleus, not substantia nigra; the donor-level
analysis leaves them out.
parkinsons_project/
├── figures/                    # All visualizations
│   ├── meta_analysis_*.png     # Meta-analysis figures
│   ├── validation_*.png        # Validation results
│   ├── risk_prediction_*.png   # Prediction toolkit
│   └── biomarker_*.png         # Biomarker analysis
├── scripts/                    # Analysis scripts
│   ├── step1-3_*.py            # Simulation scripts
│   ├── step4-5_*.py            # Visualization scripts
│   ├── step6-11_*.py           # Analysis scripts (cell-level; superseded, see below)
│   ├── step14a_*.py            # Per-cell table from raw counts + author metadata
│   ├── step14b_*.py            # Donor-level test (the current result)
│   └── validate_*.py           # Validation scripts
├── docs/                       # Documentation
│   ├── 01_PRE_REGISTRATION.md  # OSF pre-registration
│   ├── 02_PREPRINT_DRAFT.md    # bioRxiv manuscript
│   ├── 03_COLLABORATION_EMAIL.md
│   ├── 04_WET_LAB_VALIDATION.md
│   ├── 05_ARB_LITERATURE_REVIEW.md
│   └── 06_CLINICAL_TRIAL_DESIGN.md
├── analysis/donor_level/       # step14 inputs + outputs (donor_table.csv, results.json)
└── data/csv_results/           # Analysis outputs (older, cell-level)
- Pre-registration:
docs/01_PRE_REGISTRATION.mdready for OSF - Preprint:
docs/02_PREPRINT_DRAFT.mdready for bioRxiv - Collaboration: Email templates in
docs/03_COLLABORATION_EMAIL.md
- Trial Design: Full protocol in
docs/06_CLINICAL_TRIAL_DESIGN.md - Wet Lab Validation: Experiments outlined in
docs/04_WET_LAB_VALIDATION.md
Please do not change anything about your treatment because of this repository. Nothing here is medical advice, none of it is peer reviewed, and I am not a clinician or a neuroscientist. The one useful thing you can do with this is bring the underlying published research — Kamath et al. 2022 in Nature Neuroscience, and Labandeira-García et al. 2022 in Movement Disorders — to a neurologist and ask what they make of it. Those are the real sources. This repository is one person checking whether their result reproduces.
Repository: github.com/nicedreamzapp/parkinsons-vulnerability-predictor
If you use this work, please cite:
AGTR1+ Dopaminergic Neuron Vulnerability Meta-Analysis (2025)
https://github.com/nicedreamzapp/parkinsons-vulnerability-predictor

Based on:
Kamath T, et al. Single-cell genomic profiling of human dopamine neurons
identifies a population that selectively degenerates in Parkinson's disease.
Nat Neurosci. 2022;25(5):588-595. doi:10.1038/s41593-022-01061-1
This is a research project for educational and scientific purposes. It is NOT a clinical diagnostic tool. Always consult healthcare professionals for medical decisions.
Last Updated: September 18, 2026 | Status: donor-level re-test done | Donors in the primary test: 45
I went back through this analysis on 2026-08-06 and corrected two things I had overstated. Writing them down rather than quietly editing them out.
The finding worth taking seriously is that four independent cohorts, collected by four different research groups with different dissection protocols and different sequencing chemistry, all show AGTR1+ dopamine neurons depleted in Parkinson's, in the same direction. That is what this project set out to test and it is what survived.
step7_validate_gse243639.py builds its contingency table from cell counts:
a = (pd_mask & df['AGTR1_positive']).sum()Cells taken from the same donor are not independent observations. The real sample size is the number of donors — dozens, not 579,931 — so treating every cell as an independent draw inflates significance by orders of magnitude. Any p-value produced this way comes out astronomically small whether or not the biology is real, which means it carries no information.
The correct approach is to aggregate to one value per donor (percentage of AGTR1+ cells in that donor) and compare those distributions. That's a pseudobulk test, and it is the standard answer to this exact criticism. It's on the list below.
train_and_compare.py fits a logistic regression and then scores it on the same rows it
was fitted to:
clf.fit(X_scaled, y)
roc = roc_auc_score(y, clf.predict_proba(X_scaled)[:, 1])
There is no train/test split and no cross-validation anywhere in this repository. That number is in-sample fit, not accuracy, and with this many gene features it will approach 1.0 regardless of signal. It should never have been in the repo description and it is gone.
A real number requires GroupKFold grouped by donor, so that no donor appears in both
the training and test folds. Until that is run, this repository makes no claim about
predictive accuracy at all.
step2_test_intervention.py, step3_treatment_timing.py and
step12_longitudinal_model.py produce numbers like an eleven-year delay in motor onset.
Those numbers are circular and should not be quoted by anyone, including me. The
script contains this:
annual_loss_rate = 0.12
ARB_EFFICACY = 0.6     # 60% reduction in depletion rate
The drug's effectiveness is a hardcoded assumption, not something measured. The model assumes an ARB cuts neuron loss by 60%, and then reports that patients do better. That is arithmetic on an assumption, not evidence about a drug.
Nothing in single-cell RNA proportions from post-mortem tissue can tell you how many years a medication delays symptom onset in a living person. No amount of extra data changes that — it is the wrong kind of measurement for the question. These scripts are kept as a toy illustration of what a depletion curve looks like under an assumed treatment effect, and for no other purpose.
-
step8_meta_analysis.pydid not count anything. Its per-study AGTR1+ counts are typed into the script, and the old forest plot, "Key Statistics" table andmeta_analysis_results.csvwere all built from them. Recounting from the raw matrices:- GSE157783: the script says 741 of 22,433 control nuclei and 190 of 19,002 PD nuclei are AGTR1+ (3.30% / 1.00%). The data has 95 and 36 (0.42% / 0.19%). No file in this repository produces the typed numbers.
- GSE184950: typed 320 / 31; the data has 270 / 11 for Control / PD.
- GSE178265: typed 7,639 / 813; the combined file has 7,517 / 781 (and see point 3).
- GSE243639: typed 1,300 / 352; this one matches the data.
The near-identical "~3.3% control, ~1% PD" pattern across studies in the old table came from those typed values, not from the datasets. Those figures and tables have been removed from the top of this README; the old files are left in the repo only so the history is visible.
-
GSE184950 was mislabelled "Kamath 2022". It is Wang et al. 2024, Science Advances (Mount Sinai; PMID 38198537). Kamath et al. 2022 is GSE178265.
-
Caudate nuclei were counted as substantia nigra controls. 46,782 GSE178265 nuclei in the combined file come from caudate nucleus (all from controls).
-
The old percentage was "AGTR1+ of all nuclei", not "AGTR1+ of DA neurons". That cannot separate selective loss of AGTR1+ neurons from the general loss of DA neurons in PD. The donor-level test uses the DA-normalised share as its primary measure.
- Donor-level (pseudobulk) test to replace the cell-level Fisher's exact (done 2026-09-18)
- Report donor counts alongside cell counts for every dataset (done 2026-09-18)
- Adjust for age, sex and post-mortem interval
- Cross-check the marker-based DA calls against each study's own cell-type annotations
-
GroupKFoldby donor before any accuracy figure is quoted again - State the batch-correction / integration approach used when pooling cohorts
- Relabel the ARB intervention simulations as assumption-driven toys (done 2026-08-06)
The ✅ 100% column in the dataset breakdown is cell-type annotation coverage — the
share of cells that received a label. It is not a model accuracy figure.
I am not a neuroscientist, and the point of publishing the code was so that people who are can check it. If you find something else wrong, please open an issue.